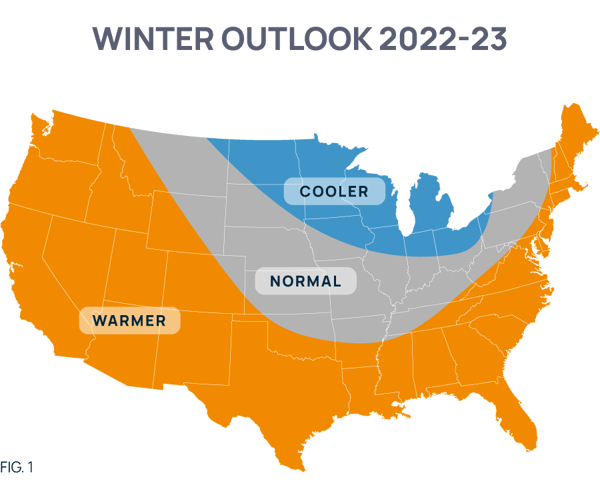
For the POWWR winter outlook, because of the building La Nina conditions, we predicted a “parabolic” temperature pattern with warm anomalies towards the southern portion of the country and colder anomalies in the north, with the strongest cold anomalies to develop in the Upper Plains and Great Lakes and warmer “wings” on the coasts (fig 1).
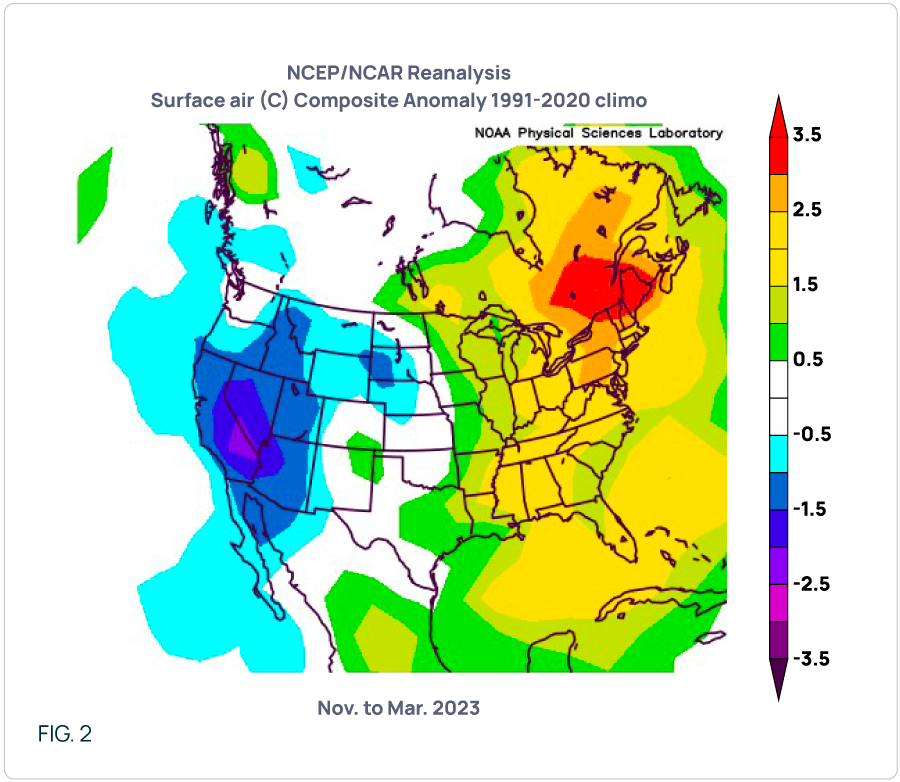
Our forecast was not on-point as the winter (NOV-MAR) actualized with a cold west and a generally warm east with the Rockies as the divider (fig. 2). While we predicted “warmish” anomalies for the Northeast, we just did not go warm enough.
Summer 2023
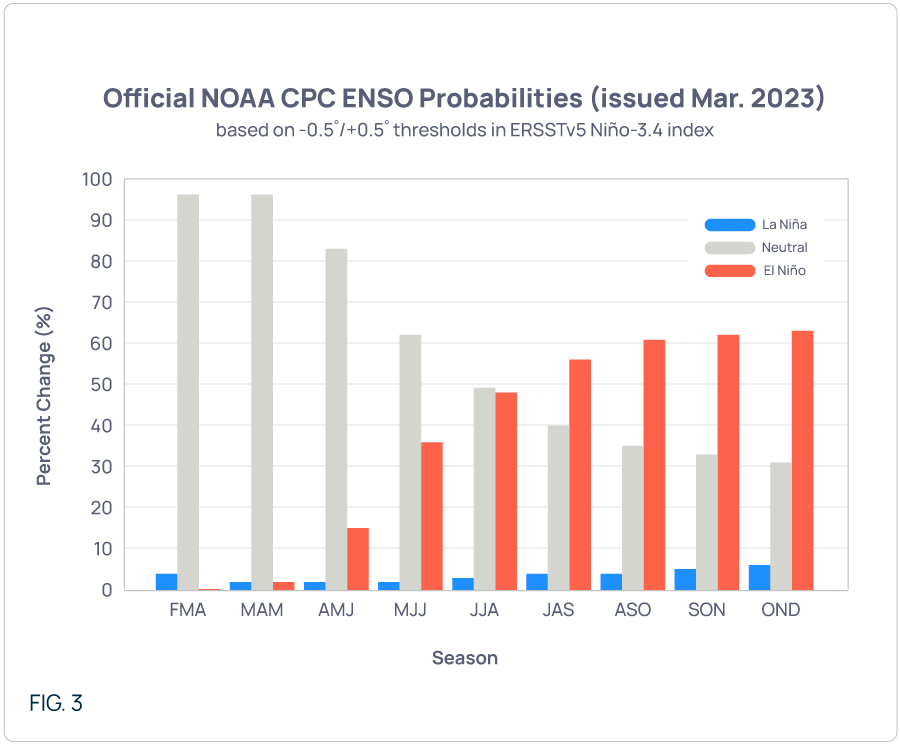
La Nina has substantially waned and we are in “neutral” conditions at present. By August/September, climate models are predicting stronger probabilities of a developing El Nino (fig 3). If you recall, El Nino is classified by warming sea surface temperatures off of the western coast of South America. This anomalously warm water then impacts the strength and position of the various jet streams during the late summer through winter months. Climatologists and meteorologists are currently seeing signs of a building warm pool off of northwest South America, indicating a building El Nino.
As you already know from reading our seasonal outlooks, both El Nino and La Nina are more of a winter-time phenomenon and thus have the most impact on that season. So while we do incorporate any teleconnections the phenomena may impart for summer, it is but one of many indicators that meteorologists and climatologists utilize in the preparation of a summer seasonal outlook.
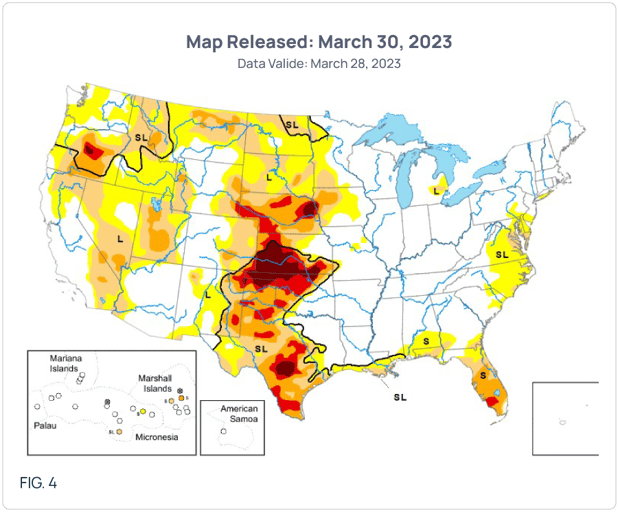
Of the other summer indicators, the most important is soil moisture. During the summer months, the presence of increased soil moisture will reduce the impact of the Sun’s radiation on warming the air molecules. Likewise, an absence of said moisture will intensify the impact and will greatly contribute to a heat wave. That being said, soil moisture is severely lacking in the Great Plains, from Nebraska to south Texas (fig 4). Thankfully, the Winter 2022/23 rains have lessened the severity of the “Exceptional Drought” that has been occurring in the Southwest. While some drought conditions are still ongoing, the situation is better than it has been.
For Summer (May-Sep) 2023, we predict two main centers of anomalous heat (fig 5). Those extreme anomalies should occur in the Intermountain West and the Great Plains. While not the most extreme of anomalies, we are predicting anomalous heat through central Texas. The lack of soil moisture will exacerbate any dome of high pressure that will build there this summer. The Northeast, Midwest, Ohio Valley, Gulf Coast, and Southeast should aggregate (for MAY-SEP) to “normal” with potential periodic bursts of heat and rain-cooled events.
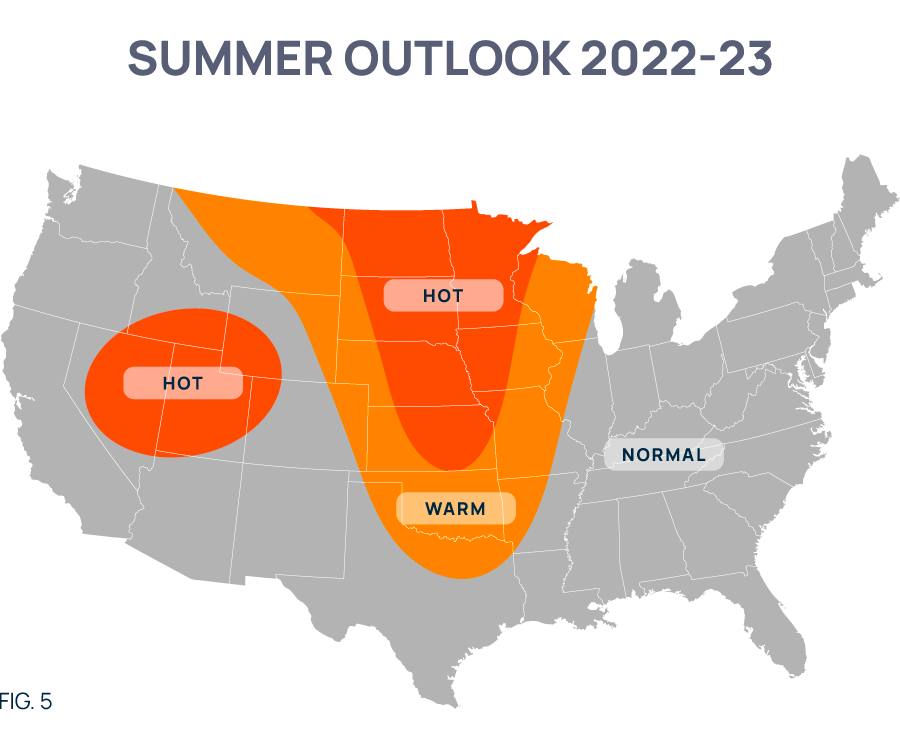
Temporally, the majority of the warm anomalies for ERCOT should be front-loaded into May-July, with the potential for cool anomalies in September. This is indicative of an El Nino that develops rather early, in late summer as opposed to during autumn. East of the Mississippi, especially in the Ohio Valley, Mid-Atlantic, and New England, we are predicting an anomalously warm August and September, back-loaded warmth. For August and September, we believe that a northward and westward intrusion of the Azores-Bermuda High will impact the eastern US (and will also have tropical weather impacts along the Gulf Coast, to be discussed in the following section).
The main risk to the outlook is likely in Texas. If the El Nino and its impacts (rain in the South) materialize in July or early August, the overall warm outlook in Texas will not materialize.
Tropical Outlook
On average, the Atlantic Basin gets 13 named storms, 6 hurricanes, and 3 major hurricanes (category 3+) each year from June 1 through November 30. For the 2023 hurricane season, we are predicting a generally normal year with 13 named storms, 7 hurricanes, with 2 of the hurricanes to be major (cat 3+). As for probable locations of landfall, we predict Florida has the highest chances at 50% followed by the East Coast at 40%. Both Texas and the central Gulf are at much lower probabilities. This likely due to their closer proximity to the impacts of the expected increased wind shear from the warm pool off the South American coast. We believe the Azores-Bermuda High will bulge eastward into the Mid-Atlantic states and the Ohio Valley during late summer, and that the tropical systems will be forced around the High and into the southern East Coast, Florida and the eastern Gulf of Mexico.
There is one factor which could limit the number and/or strength of Atlantic Basin storms this summer, the Quasi Biennial Oscillation (QBO). The QBO is a recognized pattern in the stratospheric wind field in a region of 15 degrees latitude on either side of the Equator. It is characterized by alternating strong westerly and easterly winds from the upper stratosphere down to the lower stratosphere. So, when there are strong easterly winds at the upper levels of the stratosphere, there are opposing westerly winds at lower stratospheric levels, and vice-versa. A complete cycle (from strong easterly to westerly and back to easterly at the upper level takes about 28 months (hence the “quasi-biennial” aspect).
Currently, the QBO is in its westerly phase. The corresponding westerly winds in the lower stratosphere, if sufficiently strong at both the right time and place, could have a shearing influence on the burgeoning cloud tops, thus limiting the intensity, organization, and motion of any tropical activity. This will need to be analyzed on a storm-by-storm basis. As of now, the QBO is in the correct phase to potentially limit hurricane formation. As the number of named storms the past few years (with an easterly QBO phase) have been higher than what we are predicting for this summer, the westerly QBO impact correlates with our assessment and forecast for the decreased tropical activity in the Atlantic basin to normal levels.
NOTE: POWWR provides this information as a courtesy to enhance the risk management process and are not responsible for the accuracy of this forecast and/or actions taken as a result of this forecast information.
 |
|
Mr. Palao specializes in commodity risk management and the science of meteorology/climatology. He serves as one of POWWR’s many subject matter experts. He has 20 years of experience in the energy/utility industry, where he used his skills and knowledge of meteorology and advanced statistics.
From 2000 through 2011, he worked at TXU Energy Trading/Luminant Energy in Dallas where he served in three capacities. Most recently, he served as Capital/Liquidity Manager of the trading portfolio, optimizing the use of capital while still maintaining profitability. Prior to that, he managed the Weather Derivatives trading desk, devising strategies and executing trades for both speculative and hedging purposes. Upon joining TXU, he served as manager of the Quantitative Risk Group, assisting the company in the identification, quantification, and remediation of financial risks inherent in the company’s multi-commodity trading portfolio.
In his first foray into energy/utilities, he was a Marketing Executive with Louisiana Gas Service Company, a local distribution company, where he primarily marketed natural gas technology to commercial and industrial customers. Before that, he served as a Research Scientist under contract to the National Oceanic and Atmospheric Administration (NOAA).
Mr. Palao has an M.B.A. from Tulane University. He also has both an MS and BS in Meteorology from Florida State University. He is a member of the Financial Weather and Climate Risk Management Committee of the American Meteorological Society (AMS).

Share this

2023 Winter Outlook

2022 Summer Outlook Report