
By Ian Palao | Director of Analytics
 Introduction
The PJM Interconnection comprises all or parts of thirteen states and the District of Columbia. The regional transmission organization (RTO) has about 184 gigawatts of generating capacity and serves almost 61 million residential, commercial, and industrial customers.
PJM has a day ahead (DA) offer cap of $1500 per MWh. Although it pales in comparison to the $9000 cap of ERCOT, it still does not provide a guaranteed “safe harbor” from high prices or volatility. With this analysis, I hope to quantify some aspects of my previous sentence.
Data
One year (July 2014 to June 2015) of hourly, settled DA data was gathered from PJM for the following zones, AECO, AEP, APS, ATSI, BGE, ComEd, Dayton, Delmarva, Duke, Duquesne, JCPL, MetEd, PECO, Penelec, PEPCO, PPL, PSEG, and RECO. In addition, I also extracted hourly temperature data from the applicable weather stations for each zone for the same time period.
Methodology
The analysis performed was fairly simple. Average price levels were computed by trading block for each zone and month. Daily volatilities were also computed. Average temperatures were analyzed for each utility and a correlation to price and daily volatility was performed.
Results
Price Analysis
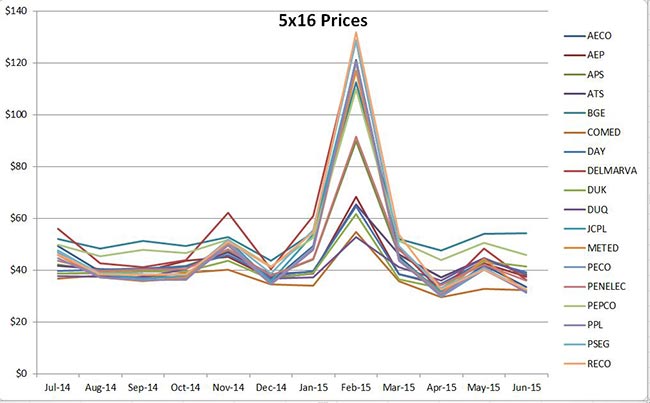
Results of the DA price analysis are surprising. I fully expected the price levels to be substantially higher during all of the winter months than during the summer months. For the period July 2014 – June 2015, that is not the case. Across all zones and block types, only the February 2015 average was substantially higher than the average price level of the other months (see figure 1 below).
FIGURE 1
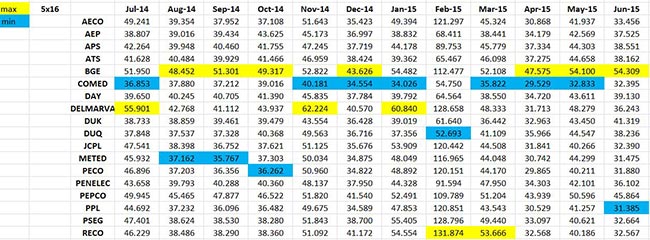
Even during January of 2015, when the average low/high temperature in PSEG was 22/35 (normal January is 23/38), average prices for all block types remained at or under $55 per MWh. Price levels did not really rise until the colder-than-normal February 2015. During that time, the 7x24 averaged $104 for the month, the 5x16 averaged $129, and the 5x8 averaged $89 per MWh. Newark’s average low/high for that month was 15/31. Normal is 25/41. As you can see, the sustained cold of February had a definite impact on DA prices in the PSEG zone. And it is similar situation for the other PJM zones in that February 2015 saw higher DA block prices (a doubling of January prices in many zones) than any of the other months due to the cold temperatures (see figure 2 below).
FIGURE 2
Volatility Analysis
Results of the daily volatility analysis tell a different tale…..volatility levels are more seasonal (see figure 3 below). We must keep in mind what we are measuring when we measure “volatility”. According to “Barron’s Dictionary of Finance and Investment Terms”, volatility is the characteristic of a security, commodity, or market to rise or fall sharply in price within a short-term period. In essence, volatility is a measure uncertainty, and, by extension, of “risk”.
FIGURE 3

In this analysis, the Jan-Feb-Mar vols for all zones and blocks are at a higher average level than that of the other months. For instance, in keeping with looking at PSEG, the summer months of Jun-Jul-Aug average under a 25% daily vol for each month for most block types. For Jan-Mar, the monthly-average daily vol did not go much below 25% except for 2 blocks, January 2x8 and 2x16. Quite a few times, the monthly-average daily volatility reached above 40% and well into the 60% level. Keep in mind that this is a daily volatility measure and not a 5-day or 10-day volatility. Five-day or 10-day will be higher by the square root of 5 and 10, respectively.
Correlation Analysis
A correlation analysis was performed by zone by month by block type between price and temperature. Results are not surprising in that the strongest correlations are in Jun-Sep (positively) and Nov-Mar (negatively) with the shoulder months being less correlated. This generally holds true for all zones and block types. Figure 4 (below) shows the results of the PSEG correlation analysis as an example.
Figure 4

Conclusions
First of all, let me state that the data analyzed (July 2014-June 2015) is only a snapshot in time and does not represent all possible characteristics/situations of the PJM market. That being said, there are important conclusions to be garnered from this analysis.
- The most obvious first…price levels are a function of the spread between supply and demand.
- Prices are strongly correlated to temperature during both the Winter and Summer as demand increases (and the supply-demand spread decreases) as the temperature decreases and increases with each season, respectively.
- Volatility has a strong, inherent recollection of past events. Past events serve as a reminder of “what could be”. Even in the 5x8 market, winter volatilities are far greater than summer volatilities. Allowing a substantial portion of your off-peak load to go into DA could be costly even in the winter overnight hours.
- During winter, because of the close proximity of one zone to another and because of the large spatial extent of the typical cold air pool from Canada, diversification between zones is not as great as one would think. For example, if PSEG is experiencing cold temperatures and high prices and volatility, ComEd, AEP, and Duquesne probably are experiencing similar.
- A heavy reliance on the DA market, especially during the most volatile season, can and will eat into your profits. No Retail Energy Provider ever went bankrupt by securing hedges to lock-in profit margin, especially during the most volatile time of year for a given ISO/market.
- Churn can easily be managed and mitigated by securing hedges outside of the DA market during known historically volatile seasons.
- Securing some peak supply (7x16, 5x16, 2x16) in the bilateral market in advance and at “reasonable” prices that fit within your average retail price/margin goals will decrease your average hedge costs by decreasing your exposure to the volatility of the DA market. Not only is this a good idea for managing your fixed load, but it can assist in maintaining the profitability of your variable and indexed customers. It is sound and prudent risk management.
For more information about the products and services of ESCO Advisors and ESCOWare, please contact Irv Lebovics at 203-456-1833.
This content is property of ESCO Advisors and all reproductions must reference and link back to the ESCO Advisors website at www.escoware.com
